You are viewing our older product's guide. Click here for the documentation of GoodData Cloud, our latest and most advanced product.
Stacked Bar Chart in Report Editor
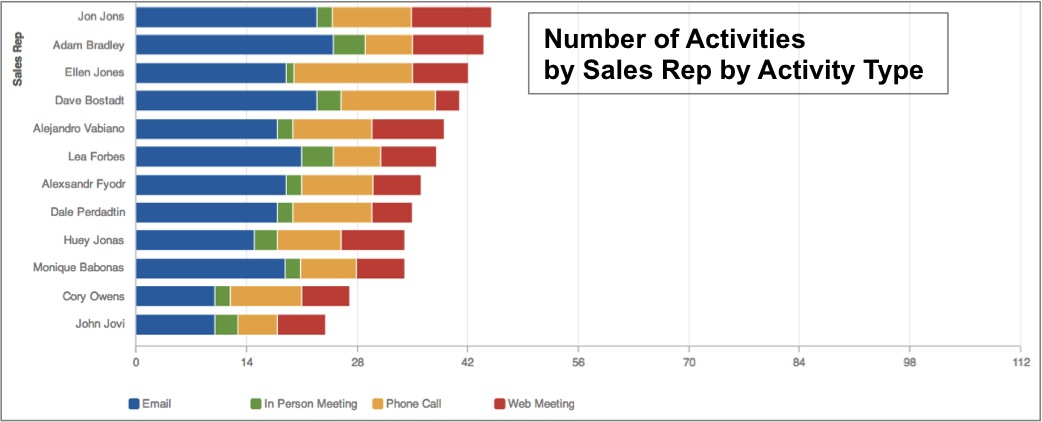
Similar to bar charts, stacked bar charts display the composition of the individual bars of the chart.
The following example displays the number of activities carried out by each sales rep and breaks down each sales rep’s activities by activity type. This chart provides a basic overview of the activities engaged by each rep. While comparing the number of emails sent by reps is fairly manageable, comparing in person meetings, phone calls, and web meetings is more difficult, due to the lack of a common baseline.
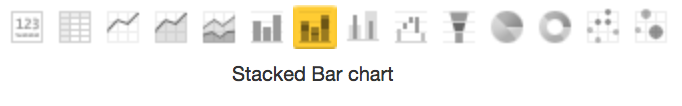
To display a report as a stacked bar chart, from the Report Editor, select Stacked Bar Chart from the list of chart icons:
For details about the report editor, see Creating New Reports in the Report Editor.