Stacked Area Chart in Report Editor
The stacked area chart is an area chart that has been stratified into constituent layers through the introduction of a second attribute.
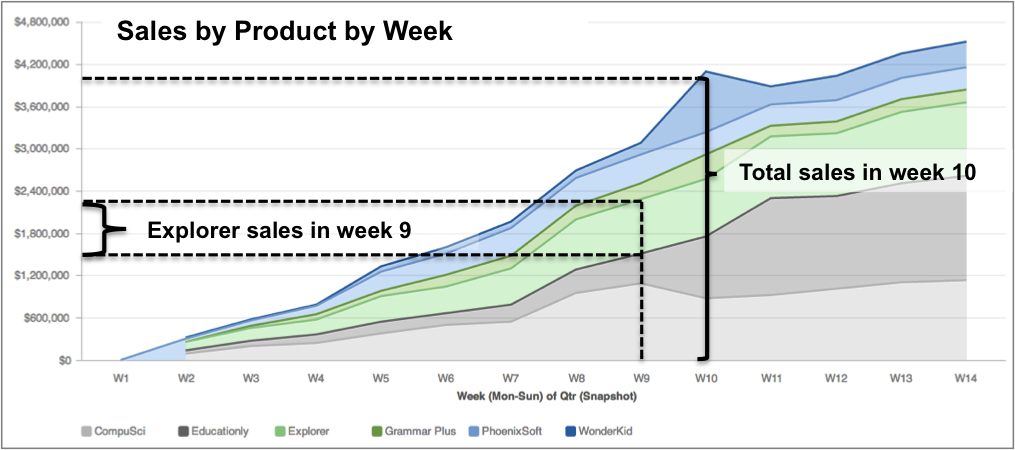
In the following example, the stacked area chart could serve as a standard area chart, if you focus on the top-most line, which signifies the total number of sales across all six products. However, in the underlying layers, you can see that the total number of sales actually consist of the sales of six individual products aggregated together. Each product’s sales are displayed in a separate layer; the magnitude of a product’s weekly sales is represented by the product layer’s height above the week along the x-axis.
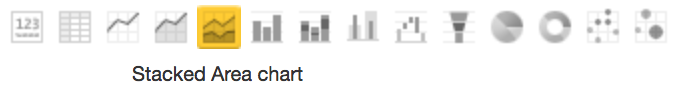
To display a report as a stacked area chart, from the Report Editor, select Stacked Area Chart from the list of chart icons:
For details about the report editor, see Creating New Reports in the Report Editor.