You are viewing our older product's guide. Click here for the documentation of GoodData Cloud, our latest and most advanced product.
Funnel Chart in Report Editor
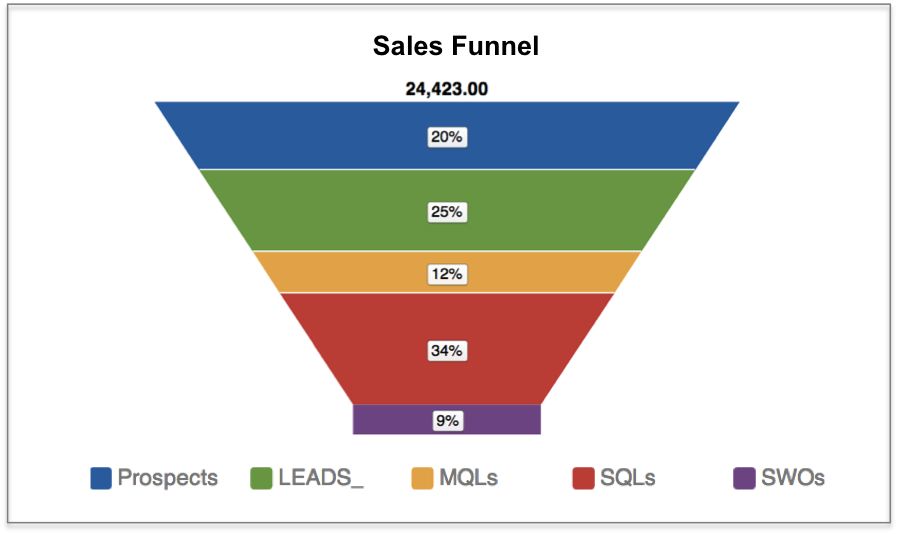
Similar to stacked bar charts, funnel charts are typically used for tracking the progress of prospects and leads through the various stages of the sales pipeline.
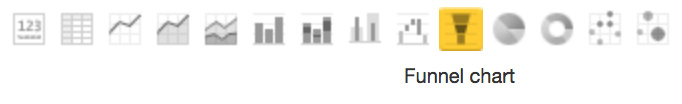
To display a report as a funnel chart, from the Report Editor, select Funnel Chart from the list of chart icons:
For details about the report editor, see Creating New Reports in the Report Editor.