You are viewing our older product's guide. Click here for the documentation of GoodData Cloud, our latest and most advanced product.
Bar Chart in Report Editor
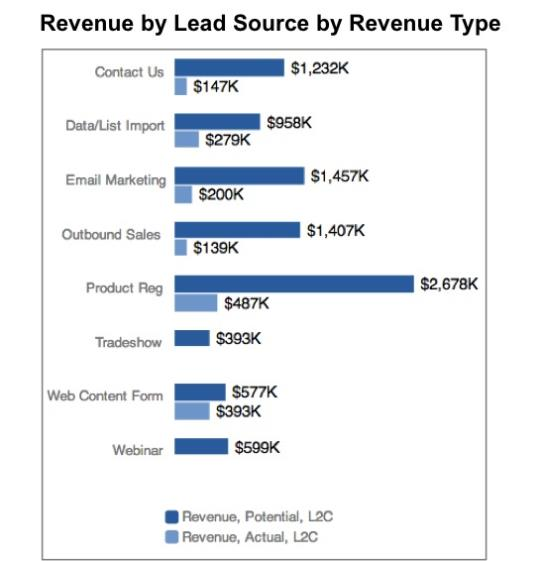
Bar charts allow you to visually compare discrete categories of data.
The following example allows a viewer to compare two metrics, actual revenue and potential revenue, across a number of different lead sources.
To display a report as a bar chart, from the Report Editor, select Bar Chart from the list of chart icons: