You are viewing our older product's guide. Click here for the documentation of GoodData Cloud, our latest and most advanced product.
Working with Charts
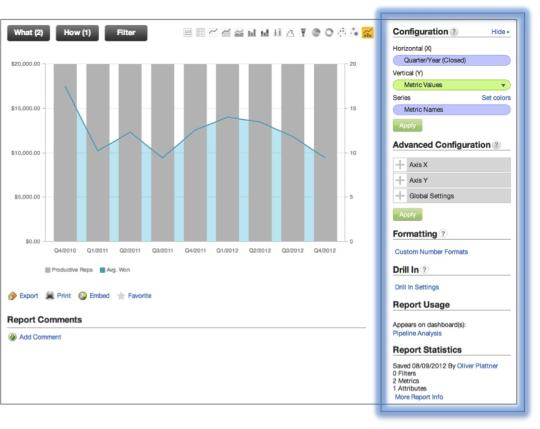
You can use the Configuration pane to configure the layout and appearance of your charts to:
- Customize chart colors
- Designate primary and secondary axes
- Adjust Global report settings
The Configuration pane is available for all report types, although for headline reports and tables the options available are mainly limited to basic formatting and establishing drill in paths. Additional configuration options are available for depending on the chart type.
For tips how to work with GoodData charts, watch the videos at the bottom of this page:
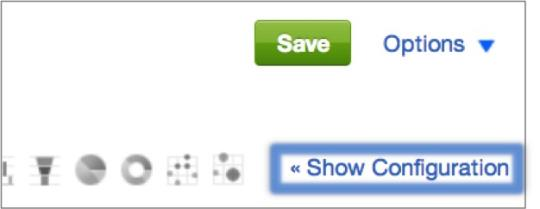
To access the Configuration pane, click << Show Configuration:
The Configuration pane is divided into a number of sub-panes. In the sections ahead, we’ll discuss each of these sub-panes in turn.
VIDEO - Tips for Working with Chart
VIDEO - How to Configure Charts
Also in this section: