Using Variables to Filter by a Child Table
Sometimes you have the situation where you need to filter a handful of metrics from a child table. The following image shows an example model.
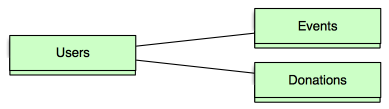
For most cases, someone would be looking to sum up donations by a user. Next, they could compare that to how many events someone has attended. Both of these tasks can easily be accomplished by a SUM of Donations.Amount and COUNT of Event.ID.
But what if you want more granular information, for example, about people who attended a specific event? Basic metrics allow you to know how many people came along with any demographic information in the users table. However, what if you want to look at the total amount of donations from people who attended that event? As the tables are not directly linked, it is not possible using basic metrics.
In this situation, each user may have attended several events along with making several donations. Because of the 1:N relationship between Users and Events, it probably does not make sense to try to change the data model to denormalize the tables.
By using variables and a metric filter, you can create a filter on our dashboard to sort by events. The overall idea is to make a metric that does a count of how many events each user is a part of, then filter on that. If a person attended an event (and with the list now being filtered down to just that item), we’ll get a value of 1 which we can now use to filter upon.
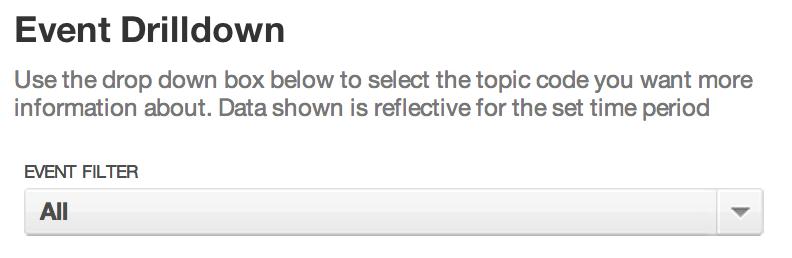
The first step is to create and name a Variable. In this example, the variable is called “Event Filter”. Set this as a filtered variable, and select the field in the Event table you want to see on the dashboard. Using Event.EventName works here.
Next, create a metric that aggregates this setting. Create a new metric, named “Event Filter Metric”, and set it up in the following format:
SELECT COUNT(EVENT.ID) by USER.ID, ALL OTHER WHERE Event Filter Variable
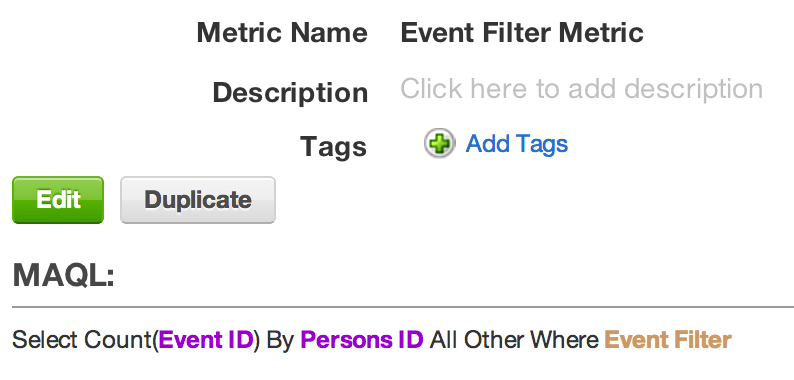
It represents a count of the ID of the child table (Event), by the ID of the parent table, filtered by the variable we just made. Go into each report on your dashboard, and add in a Numeric Range Filter. For the attribute, select the high level Connection Point - User.ID in this situation. For the metric, select Event Filter Metric where > 0. Hit save.

Finally, go to your dashboard and add on a Variable filter for the item you just made on the dashboard.
Now, whenever you use the variable filter, you can filter the results based on the membership of that event. One thing to watch out for is orphaned records in the Donations table. Any Donations that are not linked to a User will show up in all reports, regardless of the filter. This can be fixed with a second filter on all reports. Another note is that this will NOT double count donations. If you select two groups, and there is some membership overlap, the double counted members will not have their donations be doubled.