Time over Time Comparison in Reports
In this article, you will learn how to use transformations in metrics.
Imagine you are a data analyst and you would like to create a time over time comparison report for your Sales Director to have a better overview of the company’s sales data from your SalesForce CRM.
For information about comparison in Analytical Designer, see Time over Time Comparison.
Time over Time Comparison reports
To proceed, you need a data sample knowledge how to create these type of metrics with MAQL (GoodData query language, see Get Started with Using MAQL to Write Metrics). Starting with one of the simplest metrics in Sales Analytics - Amount[SUM]. This metric is predefined by default in our Sales Analytics App and gives you a total amount of all opportunities for the last snapshot. See Analyzing Change with Historical Data (Snapshotting) for more information on snapshots.
Review the following metrics:
SELECT Amount[SUM] FOR Previous(Quarter/Year(Closed))
SELECT Amount[SUM] FOR PreviousPeriod(Quarter/Year(Closed))
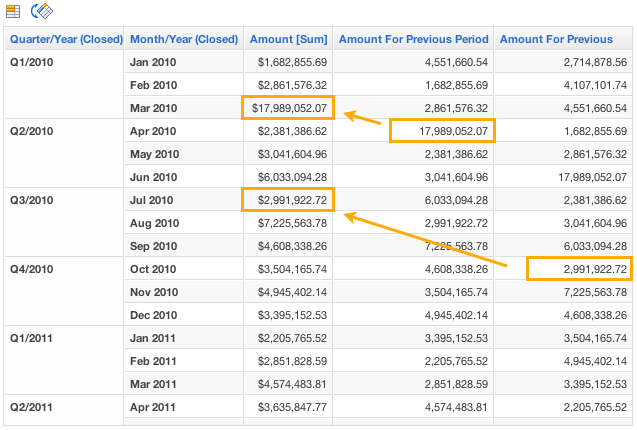
The first metric computes a number for a previous specific period of time. If you use this metric side by side with the basic Amount[SUM] and slice them by Quarter/Year and Month/Year. The metric is used in the report shown below.
The second metric, FOR PreviousPeriod(), is different from the first one. What is the difference between the FOR Previous and FOR PreviousPeriod statement? The FOR Previous is connected to the date dimension and gives you the aggregation based on previous time period from the date dimension. In our example, it gives you the same month but from the previous quarter. The FOR PreviousPeriod gives you a previous value based on records in report. See the examples in a report and tables below.
The report above and metrics with Previous statements are based on Quarter level. In the tables below, you can see more examples to understand it clearly:
Anyway, what you can also use is a second parameter inside both statements. It’s a number that tells the engine to skip the given number of the period. Again, for better understanding, see the example below:
SELECT Amount[SUM] FOR PreviousPeriod(Quarter/Year(Closed),2)
As you can see, with additional parameter added to the metric specification, it skips two Quarters and gives you the corresponding number.
Alternatively, you can also compare against future dates using two other special MAQL functions: FOR Next() and FOR NextPeriod(). Both of these constructs function in the same was as FOR Previous() and FOR PreviousPeriod() above.
Year to Date Reports
Another use that I would like to show you is Year to Date Reports and metrics. Using this special construct, you can create a metric with “This” as a day or “Yesterday”. Review the following example:
SELECT Amount [SUM] WHERE Quarter/Year(Closed) = THIS
The metric above gives you Amount of all opportunities that were closed this Quarter. You can also use THIS - 1 that is the same as PREVIOUS statement.
You can also combine the statements:
SELECT Amount [SUM] WHERE Quarter/Year(Closed) = PREVIOUS AND Day of Quarter = THIS
In this example, PREVIOUS would mean “Previous (Last) Quarter” and THIS would refer to “Today as a numeric Day of the Quarter” (i.e., Day 62 of the quarter).


