Generate Cohort Report
Cohort reporting can provide valuable feedback about the customers, users, or other groups that share a common element. Cohort reports tracks across groups to see how their data is affected over time. For example, you can create cohort reports to track subscriptions grouped by signup date to study the rates of retention over time.
This intermediate tutorial assumes some knowledge of MAQL. For more information, see MAQL - Analytical Query Language.
For subscription metrics, cohort reports typically show the percentage retained during specific time periods, which can be found using this calculation:
(recurring subscribers) / (number of subscribers in cohort)
In the following example shows how retention rates tail off over the course of the year:
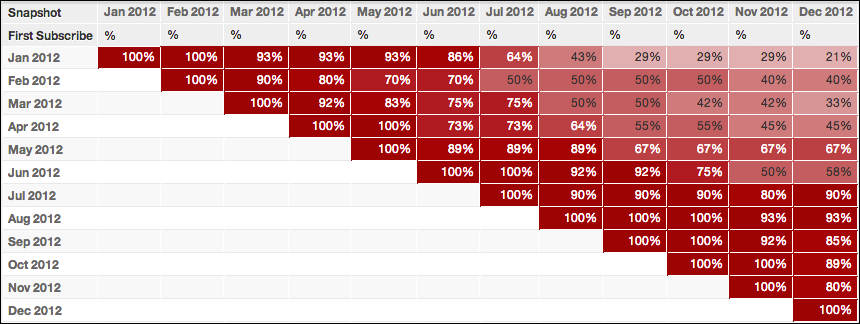
This tutorial describes how to create a similar cohort report for subscription metrics in the Portal. The use case and metrics provided in this example uses following LDM:
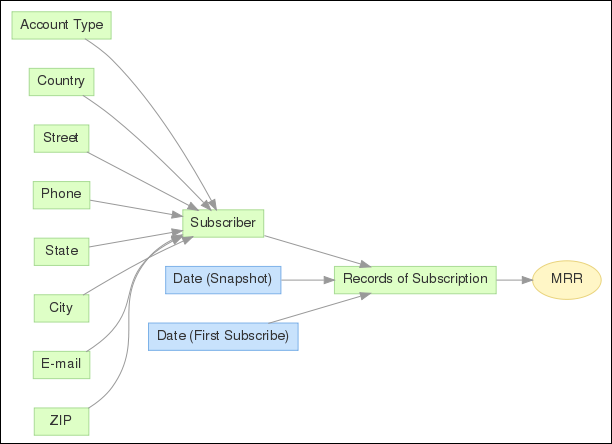
Suppose subscribers sign up during the Date (First Subscribe) and then pay subsequent amounts during following pay cycles. The frequency of payments in this project is monthly, and the dollar amount of payments is captured in the MRR (Monthly Recurring Revenue) in the LDM.
Steps:
Determining the cohorts: For this metric, subscribers must be grouped together with a relevant subscription by their Date (First Subscribe) month in a new Cohort metric:
SELECT COUNT (Subscriber, Records of Subscription) BY Month/Year (First Subscribe), ALL OTHERThe syntax BY Month/Year ALL OTHER is important in this metric because it essentially “locks” the cohort, so the same group is followed during subsequent pay periods.
Find recurring subscribers: The next metric counts the number of subscribers who paid during the month by measuring where MRR is greater than zero. When sliced by Month/Year of the recurring payment, the # Recurring Subscribers metric shows a count specific to that month.
SELECT COUNT (Subscriber, Records of Subscription) WHERE MRR > 0Tabulate the percentage: The final step is to divide the metrics created in steps 1 and 2 in the Retention Rate metric:
SELECT # Recurring Subscribers / CohortOptional: you can apply conditional formatting to display a different color based on the percentage. The conditional formatting applied to the Retention Rate metric is the following:
[>=.9][backgroundcolor=990000][white]#,##0%;[>=.8][backgroundcolor=A31919]
[white]#,##0%;[>=.7][backgroundcolor=AD3333] [white]#,##0%;[>=.6]
[backgroundcolor=B84D4D][white]#,##0%;[>=.5][backgroundcolor=C26666]#,##0%;
[>=.4][backgroundcolor=CC8080]#,##0%;[>=.3][backgroundcolor=D69999]#,##0%;
[>=.2][backgroundcolor=E0B2B2]#,##0%;[>=.1][backgroundcolor=EBCCCC]#,##0%;
[backgroundcolor=F5E6E6]#,##0%;--
For more information, see Conditional Number Formatting.