Comparing Dynamically Filtered Values in a Single Report
When working with GoodData, users often constrain a report’s data with a dashboard filter, so that certain categories of data are omitted, while others are included in a report’s computations.
This article discusses the scenario in which you want to allow users to compare a metric’s values when all categories are included with its values and some categories are filtered out, and the user wants to use a dashboard filter to dynamically control the categories filtered out at any given time.
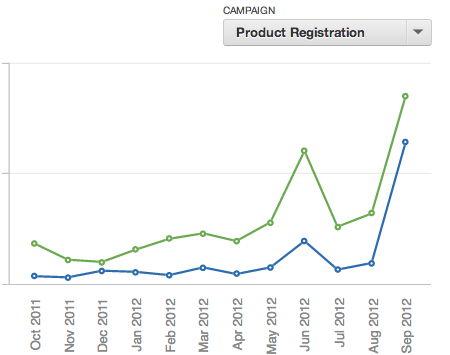
Imagine that you want to compare a metric between filtered to a specific segments to the value across all segments - and all that in a single report. For example, you want to visualize the trend in a line chart with one line representing selected segment and another one for the whole base.
In this scenario, the user must be able to select the segment dynamically using a dashboard filter.
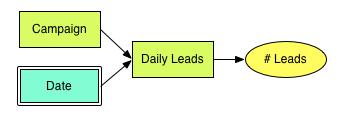
For example, you may track the average daily number of leads coming from various marketing campaigns, which naturally translates to the following logical data model:
Solution 1: WITHOUT PARENT FILTER
The requirements may seem to imply that we need two metrics: Avg Daily Leads filterable by the Campaign filter and a similar metric which is not filterable. We will define our two metrics as follows:
Average # Leads
SELECT AVG(# Leads)
Average # Leads (All Records)
SELECT AVG(# Leads) WITHOUT PARENT FILTER
The WITHOUT PARENT FILTER clause effectively shields our metric from all filters defined on dashboards, reports or outer metrics. It solves our problem but it has an undesired side effect - our dashboard may include other filters (typically a date filter) that are expected to affect both the ‘part’ and the ‘whole’ metrics - if you select to filter the period of last 30 days, you are interested about the campaign contribution to all leads created during the last 30 days rather than to all leads at all.
Solution 2: Variables
There are three kinds of filter drop downs that can be put on a GoodData dashboard: attribute filters, date filters and variable filters. Most commonly we only use attribute and date filters, but variable filters can be very helpful in some specific situations.
GoodData filtered variables are really just duplicates of other project attributes that pre-filtered for a subset of the attribute’s values. In other words, filtered variables are placeholders for the expression: “Attribute IN (Value1, Value2, …).”
GoodData also supports numeric variables, but they are not relevant in this case). But it’s also possible to create a variable to serve as a duplicate of some attribute without actually filtering out any of its values. In fact, the default setting is not to filter any values.
After you created a filtered variable, you can use it to help define reports (through variable filters) and metrics like the following:
SELECT AVG(# Leads) WHERE Campaign_Variable
Keep in mind, when Campaign_Variable is defined in such a way that no attribute values are filtered out, the metric above will compute identical results to the SELECT AVG(# Leads) metric. But with a Campaign_Variable dashboard filter, users will be able to redefine Campaign_Variable on the fly, effectively manipulating the variable metric while the original metric remains unchanged.
While variables allow us to meet all of our original objectives, they do have at least one shortcoming. While attribute dashboard filters can be interconnected in cascading parent/child relationships, this is not supported for variable filters. If cascading dashboard filters is a priority in your project, you may need to turn to another solution.
Conclusion
A dashboard that compares a filter based selection to an unfiltered value (or even multiple filter selections between each other) can be done easily with variables as they allow us to apply the filtering rule directly on a specific part of a metric rather than filtering the entire metric.
We can produce the same results by connecting the filtering attribute to the main data set indirectly via an association table and applying the filter to a COUNT sub metric.
The most trivial version is adding the WITHOUT PARENT FILTER clause to the ‘whole’ metric. However, it is not practical as it eliminate all filters including the date filters that we usually want to apply to the ‘whole’ metric too.