Create a Rank over Time Report
This tutorial shows you how to display top-10 rankings over time using the RANK function in MAQL and some report formatting. Rank-over-time reports are useful for measuring changes among your top performers (or bottom ones) if you modify the report.
Suppose you are running a Help desk and are interested in monitoring tagged issues week over week. Such analysis may assist in analyzing the top areas that are affecting the Help desk.
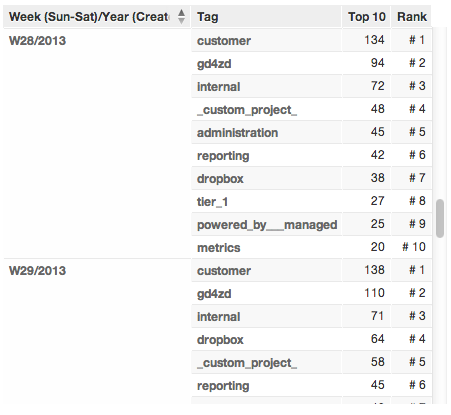
This tutorial generates a report that looks like the one that follows:
Create Custom Rank Metric
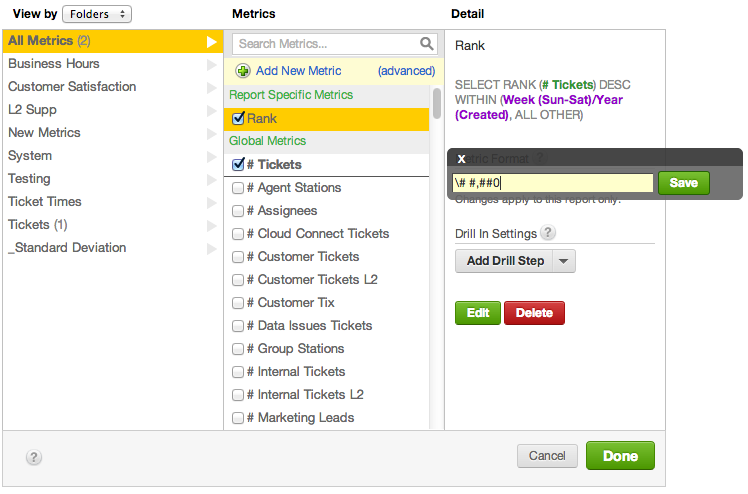
To begin, you must create a metric in the Custom Metric Editor to rank your tags 1-10 within a week. Define the Rank metric to be the following:
SELECT RANK (# Tickets) DESC WITHIN Week (Sun-Sat)/Year (Created), ALL OTHER)
- The DESC keyword forces ranking in descending order (1-10). To rank in ascending order, use ASC instead.
- The Week (Sun-Sat)/Year (Created) attribute is the time period within which to rank. This attribute must be specified in the metric.
- ALL OTHER locks the metric aggregation to the weekly level, even if it is sliced by another attribute, such as the Tag attribute.
The new Rank metric should be displayed as #1 - #10, so you can apply # #,##0 custom number formatting to the metric.
Adding the backslash to the custom number formatting enables display of the hash explicitly. Otherwise, it is treated as a placeholder for a numeral.
Slice the Report by Attributes
Next, add the following attributes through the How pane:
- Tag attribute, or use the attribute by which you wish to rank
- Week (Sun-Sat/Year (Created) attribute, which is the same one used in the Rank metric definition
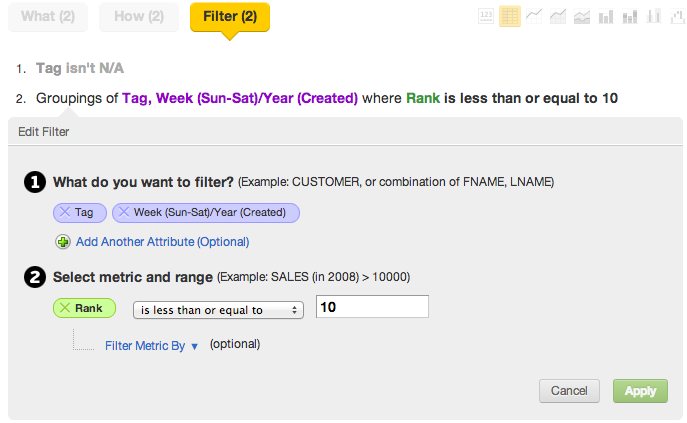
Filter the Report
To finish the report, you must configure it to display only the top 10 tags per week. Create a numeric range filter to show tags each week where Rank is 10 or less, as you see in the following screenshot: