Adding Dynamic Images to Your Workspaces
This article describes how to integrate dynamic images into your dashboards. Dynamic images changes are driven by selection of new attribute values.
You can also insert images into reporting objects such as tables.
GoodData dashboards can be easily augmented with static images to enhance the overall visual appeal and convey additional contextual information. However, these images do not change when the context changes.
For example, suppose you have added a dashboard filter to your dashboard. When the new attribute value is selected from the filter, it would be even more useful to update the dashboard image with a new version.
In GoodData, terms workspace and project denote the same entity. For example, project ID is exactly the same as workspace ID. See Find the Workspace ID.
Note that a GoodData project/workspace is not identical to a CloudConnect project.
By default, GoodData sets the maximum length of attribute labels to be 128 characters, which may be too small when referencing images by URL. If you anticipate having longer URLs, you can expand the character limit for the attribute label in your workspaces’s logical data model through the gray pages or API call. Otherwise, you can make the necessary modifications through the GoodData Portal, where the defaults for the attribute label are unchanged.
You must have administrator privileges to the workspace to which you are publishing these changes.
Prepare Source Images
Your set of source images must meet the following criteria:
- PNG or JPG format
- Stored in accessible repository, which can be accessed over HTTPS by end users
- Unique names for each image
HTTPS is mandatory. Otherwise, some browsers might not to show images properly.
Prepare Data
Depending on how the images are to be used in your dashboard, your data table should be assembled in one of the following formats.
You may access other data sources for images, provided that your URL includes any required access credentials and that the image can be referenced in a fully qualified URL.
Dynamic images controlled by a filter
If you intend to insert images into your dashboard so that their selection is controlled by a dashboard filter, your data should be assembled in the following format:
| Employee ID | Employee Name | Employee Image |
| 1 | Person1 | source=web&url=https%3A%2F%2Fwww.example.org%2Fimage1.jpg |
| 2 | Person2 | source=web&url=https%3A%2F%2Fwww.example.org%2Fimage2.png |
In the above configuration, the Image Field value is a concatenation of the string source=web&url= and the URL-encoded version of the URL to the location of the image.
Images referenced in a table report
If your images are to appear in a table report, your data should be assembled in the following format:
| Employee ID | Employee Name | Employee Image |
| 1 | Person1 | source=web&url=https%3A%2F%2Fwww.example.org%2Fimage1.jpg |
| 2 | Person2 | source=web&url=https%3A%2F%2Fwww.example.org%2Fimage2.png |
In the above configuration, the Image Field value is a concatenation of the string source=web&url= and the URL-encoded version of the URL to the location of the image.
The previous data format that included direct URL references to the images (such as, https://www.example.org/image1.jpg) has been deprecated. Do not use it.
Prepare Metadata
Prepare the metadata for your workspace so that the workspace can display the source images you have defined.
Defining the Attribute Label
Through CloudConnect Designer, locate an attribute that uniquely identifies the content of the image. In the above data table, this attribute corresponds to the Employee ID column. Add a label, that corresponds with the Image column, to this attribute.
A label is a reference to the attribute in a different form.
CloudConnect Designer is a separately downloadable application that you install on your local desktop. It is used for building logical data models and ETL graphs for use in your GoodData workspaces. Before you begin, you must download and install CloudConnect Designer. For more information, see the Downloads page at https://secure.gooddata.com/downloads.html. If you are a white-labeled customer, log in to the Downloads page from your white-labeled domain: https://my.domain.com/downloads.html.
Steps:
- On your local desktop, launch CloudConnect Designer.
- In the Project Explorer tab, select the workspace you wish to change.
- In the
modelfolder, you should find the *.LDM file or files for your workspace. Double-click the logical data model file you wish to edit. - To the appropriate dataset, add or modify the attribute label.
Double-click the dataset. The Attributes and Facts window opens.
Suppose your Employees dataset looks like the following in the Attributes and Facts window:
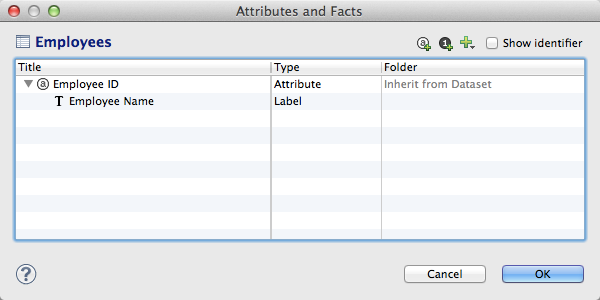
For information purposes, click the Show identifier checkbox. To the above dataset, you must add the label. To add a label, click the Plus icon. Select Add Label for > Employee ID.
If you intend for the image to be clickable, add the column as a Hyperlink.For the Title of the new entry, enter
Employee Image. Verify that the type has been specified as a Label.Click the Show Datatypes checkbox. In the Datatypes column, click the entry for the new label. Click the Browse… button.
In the Select Datatype window, verify that the Text radio button has been selected. In the textbox, enter
255.The absolute limit on the length of the attribute is 255 characters.When you are finished, the dataset definition should look like the following:
Example dataset with added label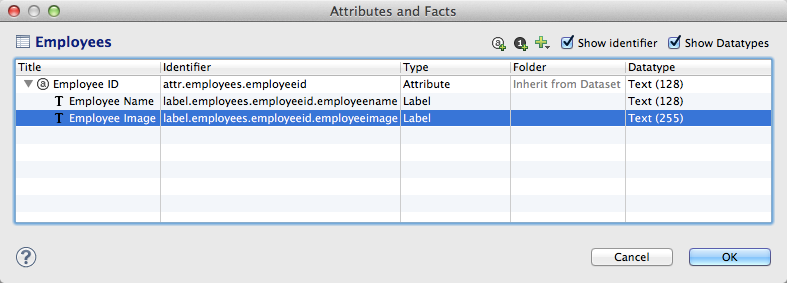
Write down the internal identifier for the attribute and each label. You will need it later.
To save the dataset changes, click OK.
Verify that the logical data model is associated with the proper workspace. In the Project Explorer tab, secondary-click the target workspace and select Working Project for….
Before you publish, you should validate. Secondary-click in the Model Editor pane and select Validate… .
If validation passes, save the *.LDM file.
Click Publish model to server in the Details sidebar.
The workspace has been updated to add the label to the unique identifier for each image.
Update the ETL Graph
Now, you must update your ETL graph to add the values for the new attribute label. You must either:
- Update an existing ETL graph to include a new column. You may be required to republish all the data in the ETL graph.
- Create a new ETL graph that populates this attribute label.
For more information on creating ETL graphs in CloudConnect Designer, see Disconnecting Dataset Directly.
Update the Workspace Definition
In your GoodData workspace, you must update the workspace definition so that it is aware that the display form of the label is an image.
Previously, this step required that you modify the LDM via GoodData API. Now, the following process enables you to complete this update through the GoodData Portal.
Steps:
- Log in to the GoodData Portal.
- From the workspaces drop-down, select the workspace to which you have published the logical data model.
- From the toolbar, select Manage. In the Data tab, click Attributes. Select the attribute to which you added the label (e.g. Employee ID).
- The object information is displayed for the attribute and its labels.
- In the Controls column under the Labels section, click the Edit link.
- From the Type drop-down, select Image.
- Your attribute definition should look like the following:
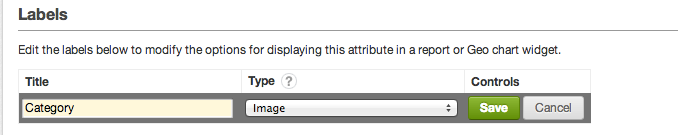
- Click Save. The workspace definition has been updated.
Define Reports and Dashboards
Now that the workspace’s logical data model and ETL graph have been updated to utilize the new attribute label, you must create the workspace objects to access and display these images.
In the steps below, you can see how these images can be made available in reports and dashboards.
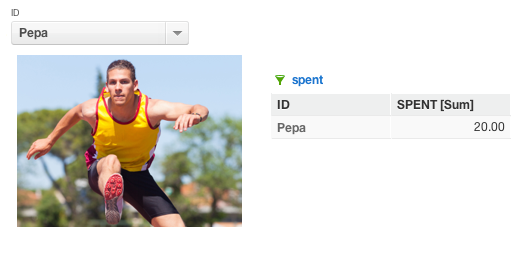
Example - Adding Images to a Report
In this example, you can add the label to a tabular report as a column displaying the attribute values, which reference the stored images.
Steps:
- Log in to the GoodData Portal.
- From the workspace drop-down, select the workspace to which you have published the logical data model and ETL graph changes.
- In the Portal menu, select Reports.
- In the Reports page, open or create a new report.
- Click the How step.
- From the list of available attributes, navigate to the Employee ID and select it.
- In the Filter Values column, select
Employee Imagefrom the drop-down. - To add the attribute label, click Done. The report is updated with the new column.
Example - Adding Images to a Dashboard
Adding a Dashboard Filter for the Image
At this point, you need to add a dashboard filter to filter on the values for the Employee ID attribute. When the dashboard filter is configured, selections made in the filter automatically filter all content in the dashboard tab to display only for the selected attribute, which means that filtration is also applied to the dynamic image object you specify below.
When configuring the dashboard filter, you should specify that users may select only one value in the Selection tab.
For more information on adding dashboard filters, see Dashboard Filters.
Adding the Image Set to the Dashboard
Now, you can add the image to your dashboard using the following steps.
Steps:
Log in to the GoodData Portal.
Select the workspace from the workspace drop-down.
From the Dashboards menu, select the dashboard to which you wish to add the image.
Click the tab of the dashboard to which to add the image.
Click the Edit icon.
In the Edit toolbar, click Web Content.
Insert the following URL:
https://secure.gooddata.com/gdc/app/projects/%CURRENT_PROJECT_HASH%/images?displayFormIdentifier=[label_id]&attributeElementUri=%FILTER_VALUE([attribute_id])%[label_id]= the internal identifier for the label containing the image data.[attribute_id]= the internal identifier for the parent attribute- For a specific example, see “Example - Displaying Player Image by Jersey Number” below.
Click Save.
Resize and reposition the image as needed.
At this point, you should be able to use the dashboard filter to select values for the Employee Name, which automatically updates the displayed image.
Example - Displaying Player Image by Jersey Number
Suppose you are building a workspace to track statistics for a sports team and want to filter a dashboard based on the jersey number of the individual. In addition to creating a dashboard filter based on the jersey number, you want to display a picture of the player based on the individual’s jersey number.
In this case, you should complete the all of the above steps with the following changes.
- Acquire an image of each player.
- Acquire the workspace identifier for the workspace to contain the images through the GoodData Portal. In this example, we will use the following:
MyProjectHash. - In the logical data model, locate the attribute that is used to identify the individual. Create a label for this attribute for jersey number. The display name of this label should be
jersyno. - Write down the internal identifier for the attribute and the label. For purposes of this example, we will use
label.support_gooddata_test.jersynofor the label andattr.support_gooddata_test.jersynofor the attribute. - Make necessary changes to the logical data model and ETL graph and publish to the workspace.
- In the GoodData Portal, create the report to contain the image and the dashboard filter to be used to filter based on the jersey number.
- In the dashboard that is to contain the image of the player, insert the following URL as web content:
https://secure.gooddata.com/gdc/app/projects/MyProjectHash/images?displayFormIdentifier=label.support_gooddata_test.jersyno.imageurl&attributeElementUri=%FILTER_VALUE(attr.support_gooddata_test.jersyno)%
The above represents the basic set of configuration steps. Be sure to test the results.
Test the Results
Before you release these reports to your end users, you should review the results of each report using the image resources and perform significant sample testing to verify that the reports are being populated with the appropriate images.