You are viewing our older product's guide. Click here for the documentation of GoodData Cloud, our latest and most advanced product.
Treemaps
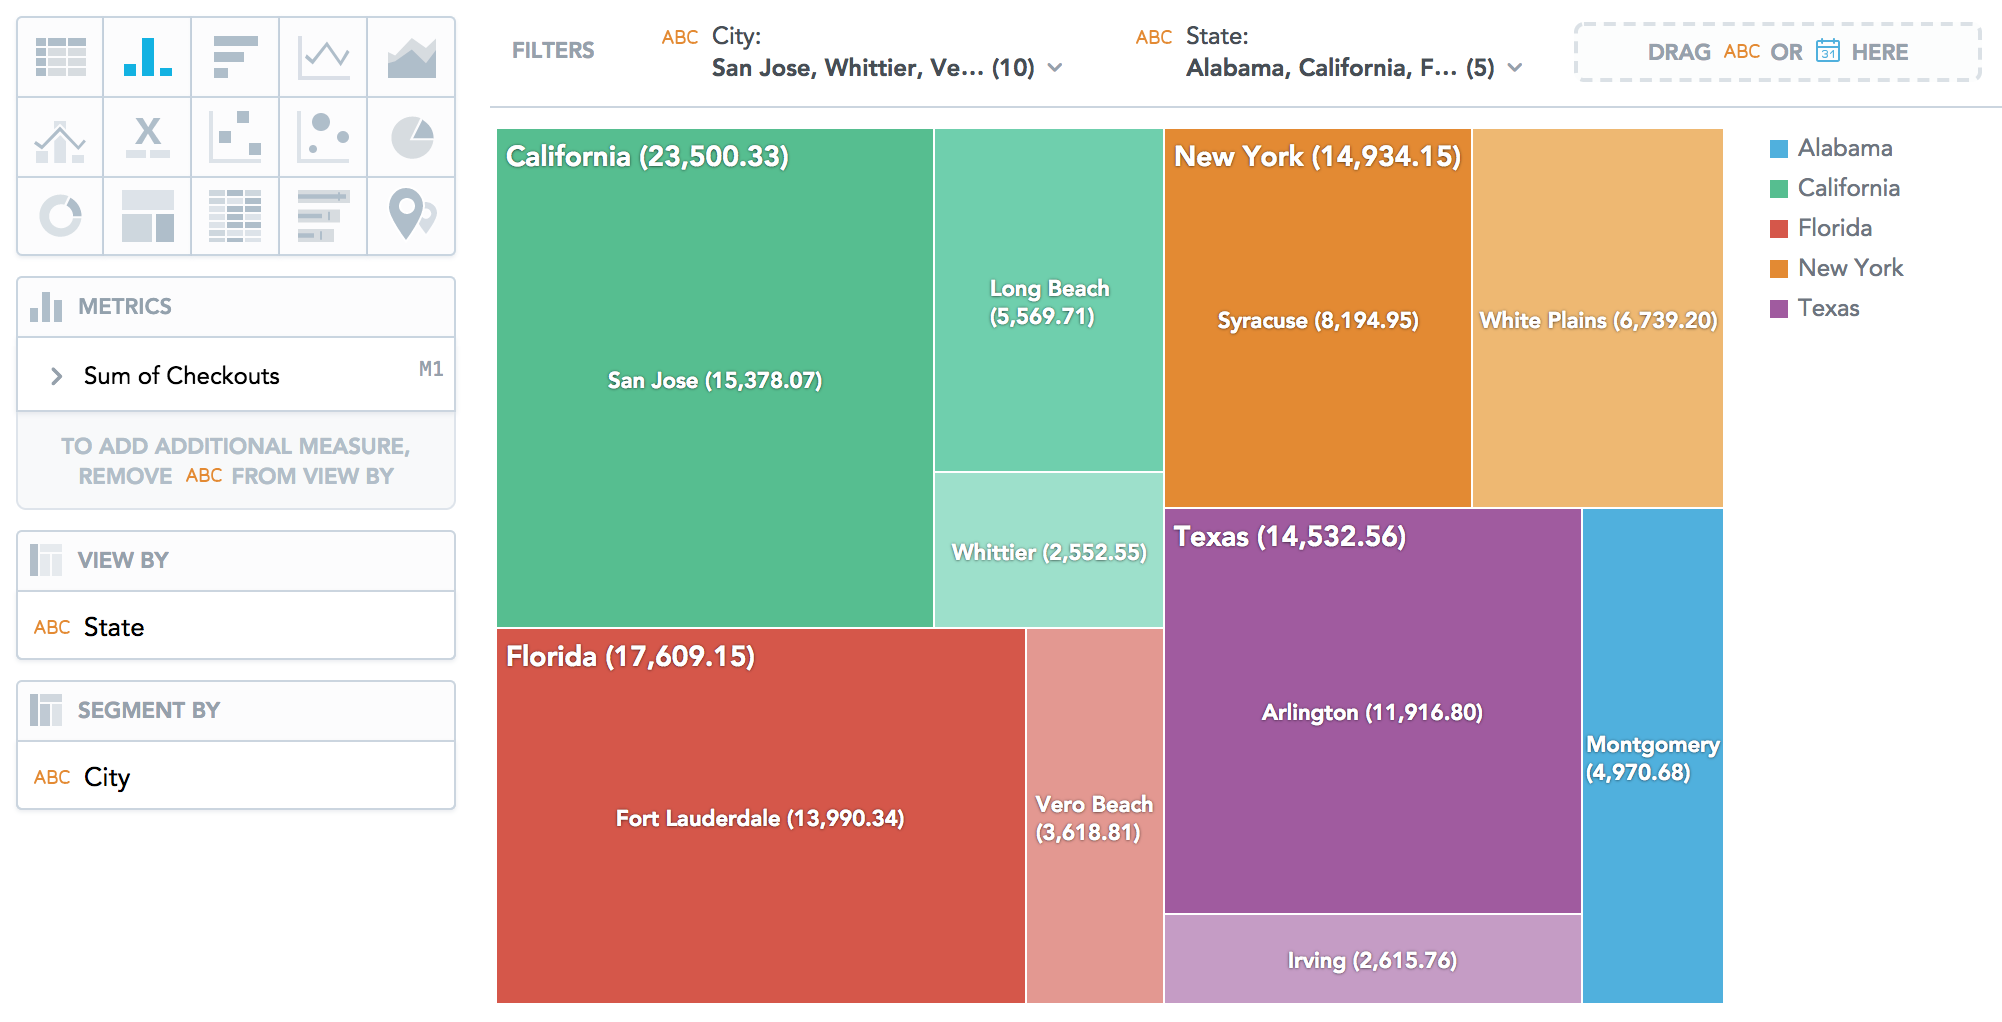
Treemaps display your data hierarchically as nested rectangles. Treemaps are useful for comparing proportions within the hierarchy.
Treemaps have the following sections: Metrics, View by, Segment by, and Configuration.
In treemaps, you can also:
- Display the values as a percentage. You must add Dates or Attributes to the View by section.
- Segment the treemap by attributes. The treemap shows the attributes as different shades of a color. To add attributes to the Segment by section, you must have only a single item in the Metrics section.
- Slice your data by attribute or date. You must add Date or an Attribute to the View by section.
For information about common characteristics and settings of all insights, see Insight Types.