Bullet Charts
Bullet charts display performance of metrics and progress towards a goal specified by another metric.
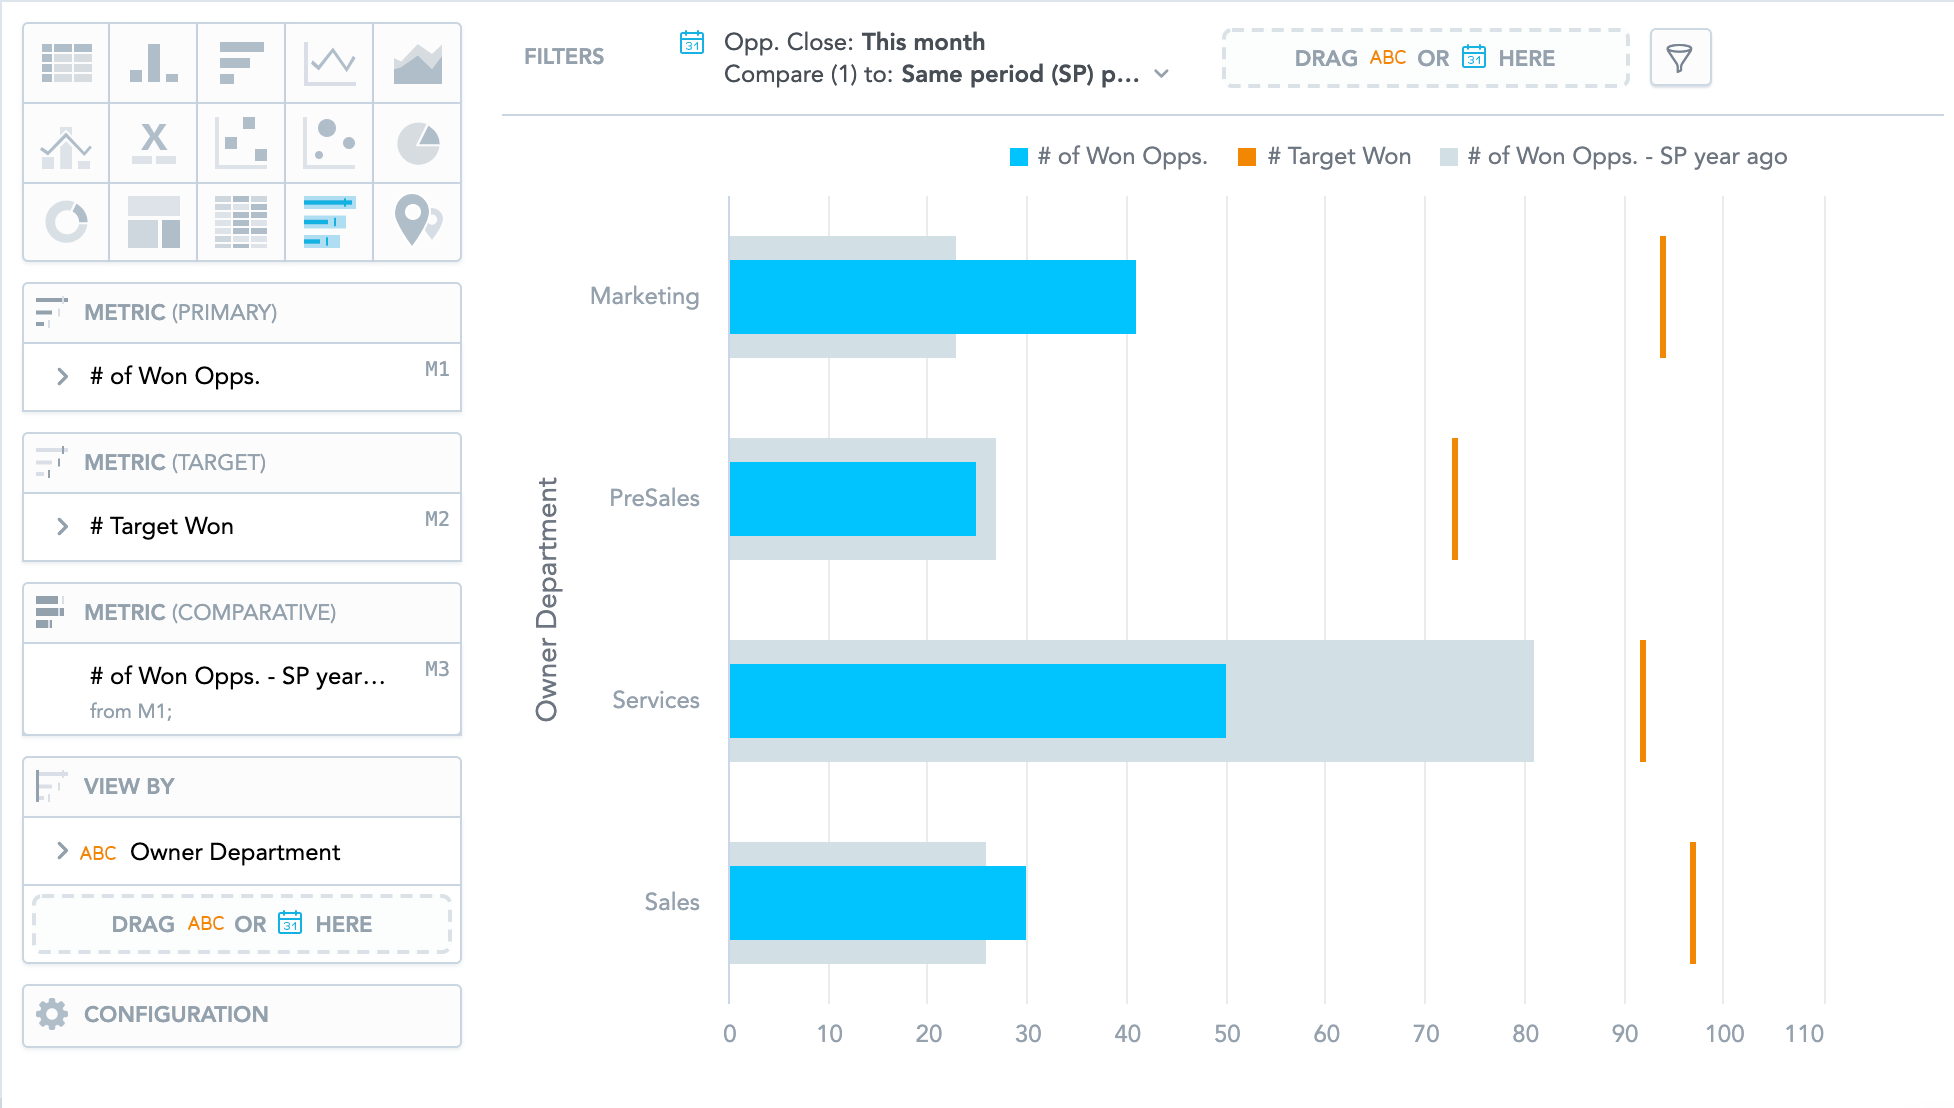
Bullet charts have the following sections: Metric (Primary), Metric (Target), Metric (Comparative), View by, and Configuration.
In bullet charts, you can also:
- Compare your data to previous period or same period of the previous year. For details, see Time over Time Comparison.
- Slice your data by up to two dates or attributes. Add the dates or attributes to the View by section.
- If you add two dates in the View by section, they must have the same date dimension (the Date as option) - if you change the date dimension of one date attribute, Analytical Designer changes the date dimension of the second date attribute automatically. The Group by option can have different values.